
Deployment takes an afternoon. Adoption takes a quarter, and it is the only part that produces a return.
Ask an IT leader how the Copilot rollout is going,g and you will usually get a deployment answer. Licences assigned, tenant configured, training sessions delivered, attendance numbers healthy. All true, all measurable, and none of it evidence that anyone’s work has changed.
Ask the same question three months later, and the mood is different, because the licence renewal is visible on the horizon and somebody has started looking at usage reports.
The shape of the problem
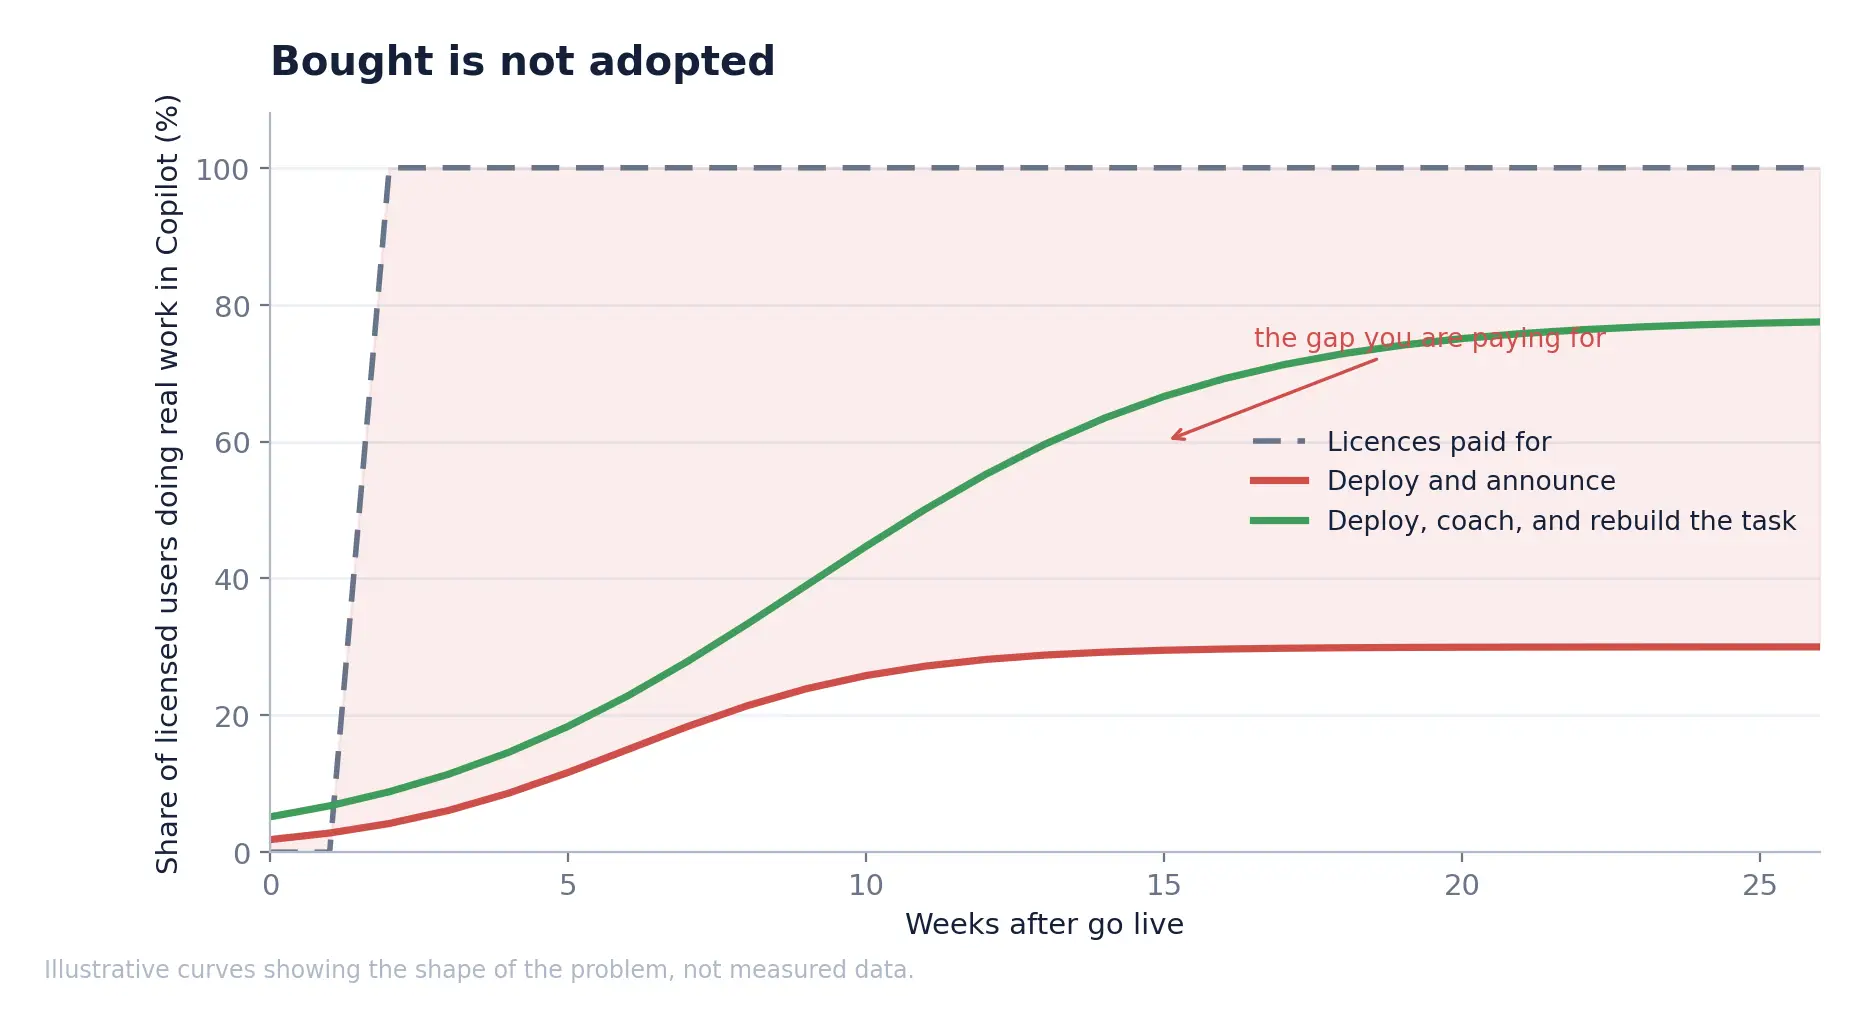
Two things happen in most rollouts. The first is an enthusiasm spike: people try it, produce something impressive, tell a colleague. The second is a plateau at a level far below what was budgeted for, because trying a tool and changing how you work are different activities and only one of them is hard.
The gap is not a training problem, which is the usual first diagnosis. People generally understand what Copilot does after twenty minutes. What they do not have is a specific reason to use it on Tuesday morning for the thing they actually have to do.
Why organisational factors dominate
Microsoft’s 2026 Work Trend Index put a number on something practitioners have suspected for a while. Organisational factors, meaning culture, manager support and talent practices, drive roughly twice the AI impact of individual mindset and behaviour.
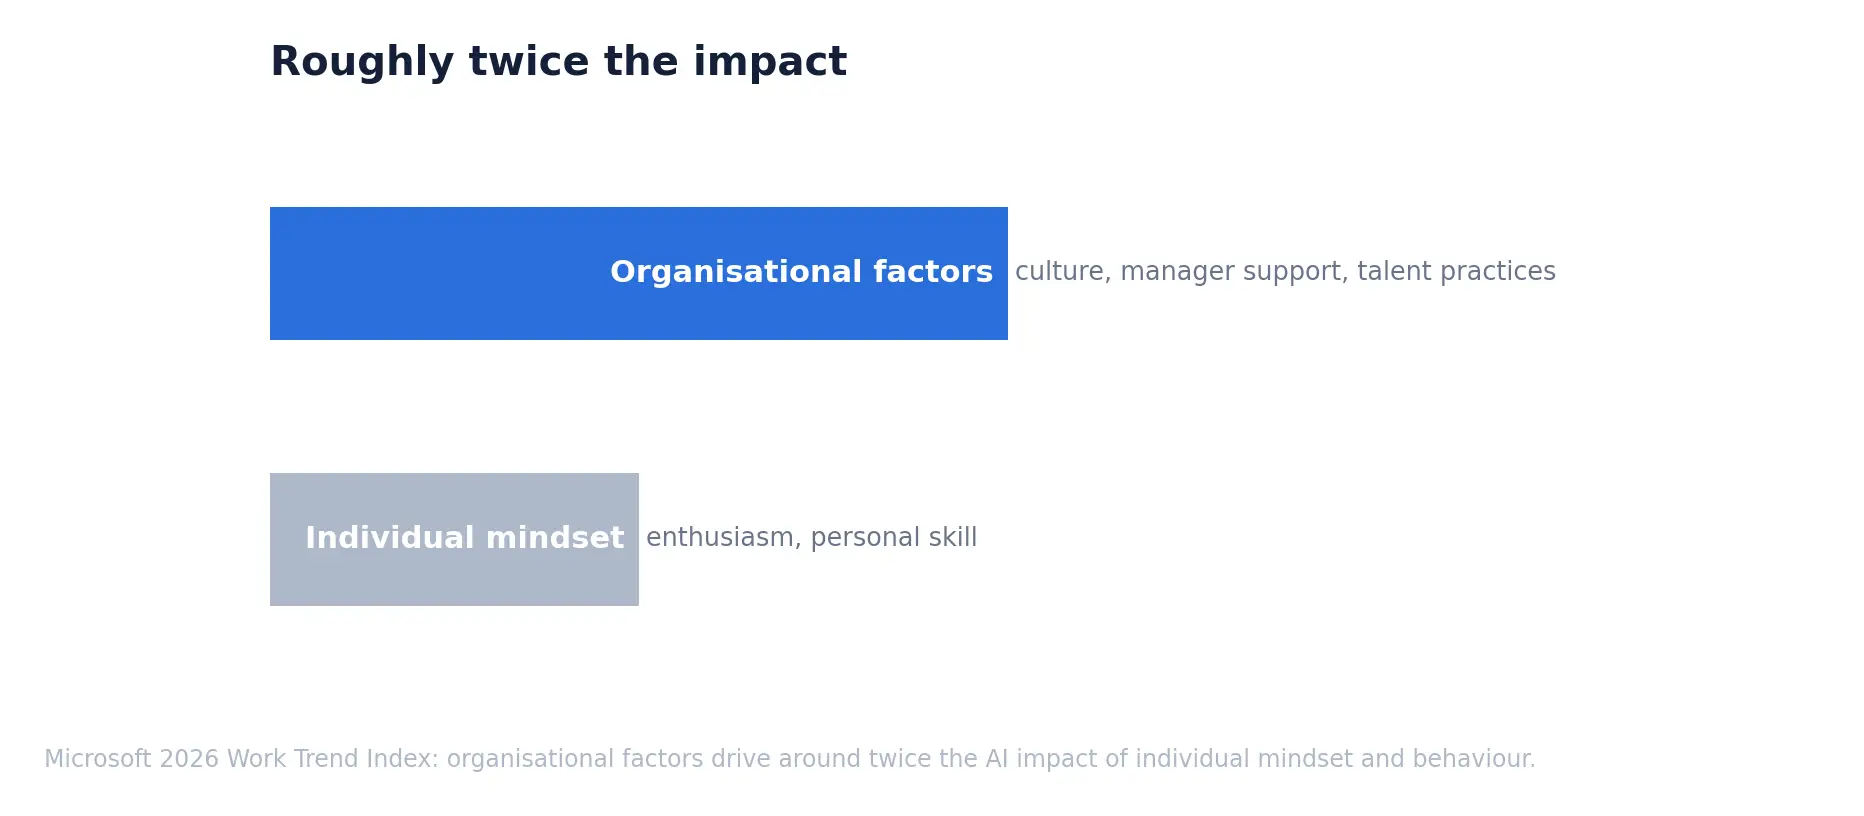
That finding should redirect most adoption budgets. The typical programme spends heavily on the individual half: awareness campaigns, champion networks, prompt libraries, lunch-and-learns. Useful, and roughly a third of the available effect.
The organisational half is harder and less fun. It means a manager telling their team that the weekly report is now drafted by Copilot and reviewed by a person, and that this is how it works from now on. It means changing what good output looks like. It means someone deciding that the four hours the team used to spend on something is now spent on something else, and naming what that something else is.
That is management work, not enablement work, and it cannot be delegated to a champions network.
The loop that actually works
The most effective adoption I have seen does not look like a programme. It looks like a small, slightly tedious loop, run deliberately, one task at a time.
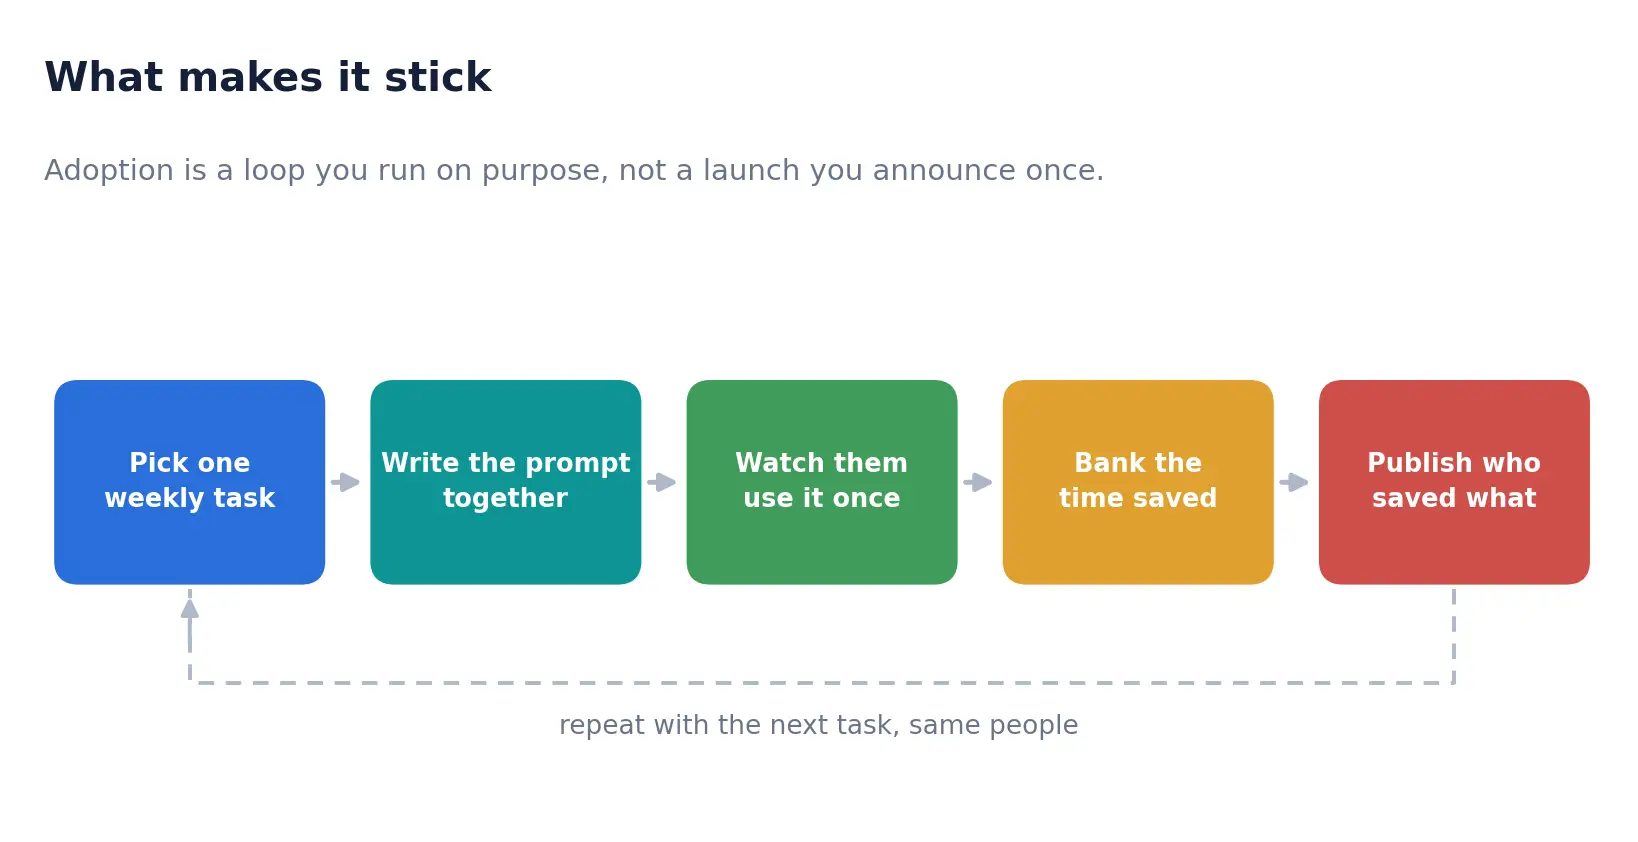
Pick one weekly task. Not a role, not a department. One recurring task that a specific group of people does, that takes too long, and that produces a document or a decision.
Write the prompt with them, not for them. Prompt libraries fail because a prompt written by someone else, for a task described in the abstract, never quite fits. A prompt written alongside the person doing the work, using last week’s real example, fits perfectly and they remember writing it.
Watch them do it once, unaided. This is the step everyone skips, and it is where you learn what is actually wrong. Usually, it is something small and stupid: they cannot find the entry point, the output format is not what the next person downstream needs, or the source document is in a place Copilot cannot access.
Bank the time saved and publish who saved it. Not aggregate statistics. Named people, named tasks, real numbers. Peer evidence moves colleagues in a way that anall-stafff email never will.
For the practitioners
- The Copilot Control System in the Microsoft 365 admin centre gives you usage, cost and agent management in one place. Use it to spot the difference between people who tried Copilot once and those who use it weekly.
- Watch for the licences assigned to people whose work has no natural AI-shaped task. Reassigning twenty unused licences to a team with a genuine use case is the cheapest win available.
- Microsoft’s analysis of over 100,000 Copilot conversations foundthat 49% supported cognitive work,k such as analysis,problem-solving,g and evaluation, rather than pure drafting. Adoption programmes that only teach drafting are not ambitious enough.
- Set a spending limit and monitor credit consumption early if you are using agents with variable cost. Two similar agents can consume very different volumes of input depending on how much context they ground and how much multistep reasoning they perform.
The renewal conversation
At some point, someone will need to justify the licence spend. The answer that works is not a usage percentage, because it invites the obvious follow-up about the people not in it.
The answer that works is a list of tasks that are now done differently, with the before-and-after times and the name of the manager who made the change stick. That is a much smaller and more specific claim than transformation, and it is the only kind of claim that survives scrutiny.
It also has a useful property: it compounds. Once a team has genuinely changed one task, the second task is dramatically easier because the argument about whether it works has already been settled locally by people they trust.
The champion trap
Nearly every rollout builds a champions network, and there is nothing wrong with the idea. The trap is what tends to happen next.
Champions are, by selection, the people who were going to adopt anyway. They are enthusiastic, technically curious and comfortable experimenting. They produce impressive examples, which get shared, which makes the programme look healthy. And the population they influence most effectively is the population that needed the least influencing.
Meanwhile, the people who matter for the business case are the competent, busy, slightly sceptical majority who have a working method and no particular reason to change it. An enthusiast’s demo does not move them. They are moved by their own manager changing expectations and by a colleague at their level saying that this specific task is now genuinely faster.
So use champions, but measure the programme on the second group. If usage is concentrated in the people who volunteered, you have a community, not an adoption curve.
Measuring adoption without fooling yourself
Usage statistics are easy to gather and easy to misread. A few distinctions are worth making explicit before anyone reports a number upwards.
- Active users tell you who opened it. Weekly repeat users on the same task tell you whose work changed. Only the second one predicts a durable benefit.
- Breadth across many features usually indicates exploration. Depth on one or two indicates a habit. Depth is the better signal, and it looks less impressive on a dashboard.
- Look at the distribution rather than the average. Forty per cent adoption, where one department is at ninety and five are at ten, en is a completely different situation from a uniform forty, and it calls for a completely different response.
- Track the tasks, not just the tools. A list of ten named tasks now done differently is more informative than any percentage, and it is the thing you will need at renewal.
The uncomfortable version of this: if you cannot name the tasks, the programme has not yet produced a benefit, even if the usage dashboard shows otherwise. That is not a reason to panic at month three. It is a reason to change what the programme is spending its time on.
What to take away
- Deployment and adoption are separate projects. Please budget for only one of the two, and we will send you the one you budget for.
- Spend more of the adoption effort on managers and process change than on awareness and training.
- Work one task at a time with the people who do it, using their real examples.
- Publish named, specific savings rather than aggregate usage percentages.
- Reallocate unused licences early. It is the fastest way to improve the return without spending anything.
